Five waves with the trend, three against
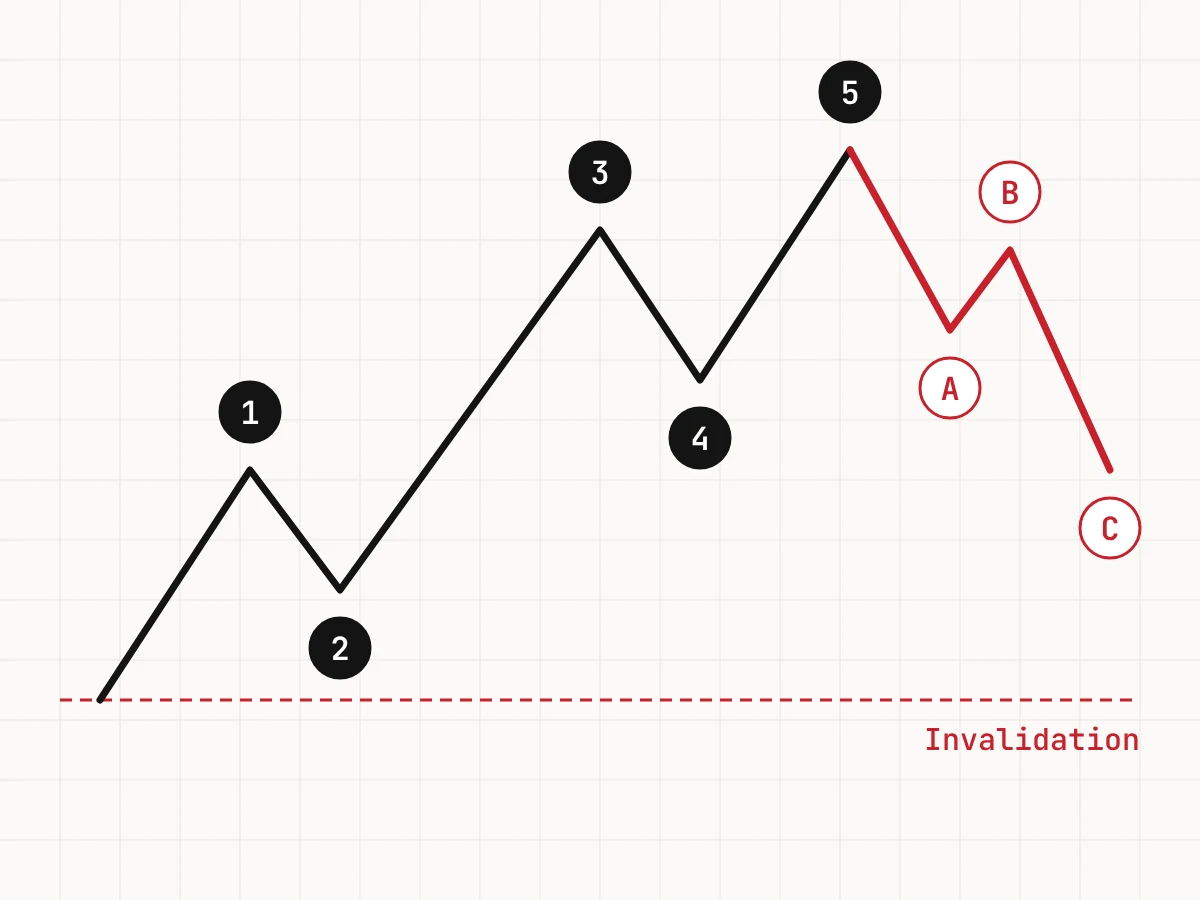
In the 1930s, Ralph Nelson Elliott observed that market trends tend to move in a recognizable pattern. A trend advances in five waves, called an impulse, and is then corrected in three waves, labeled A-B-C.
- Waves 1, 3 and 5 move in the direction of the trend.
- Waves 2 and 4 are pullbacks against it.
- Waves A and C move against the larger trend, and wave B moves back in the direction of the trend.
The same pattern works in a downtrend, mirrored. Inside an impulse, waves 1, 3 and 5 are themselves made of five smaller waves, and waves 2 and 4 of three. Common corrections include the zigzag (a sharp three-wave move), the flat (a sideways three-wave move) and the triangle (five overlapping waves labeled A to E). Before you start counting, make sure you can read swing highs and lows cleanly: see How to read price charts.
Three rules and some guidelines
A standard impulse has three rules that cannot be broken. If a count breaks one, the count is wrong.
- Wave 2 never retraces more than 100% of wave 1. In an uptrend, it cannot fall below the start of wave 1.
- Wave 3 is never the shortest of waves 1, 3 and 5.
- Wave 4 does not overlap wave 1’s price territory. In an uptrend, it cannot fall below the top of wave 1. The exception is a diagonal, a wedge-shaped variation that appears in specific positions.
Guidelines are different. They describe what often happens, not what must happen:
- Wave 2 often retraces 50% to 61.8% of wave 1.
- Wave 3 is often the longest and strongest wave, frequently about 1.618 × the length of wave 1.
- Wave 4 often retraces 23.6% to 38.2% of wave 3.
- Wave 5 is often about equal to wave 1 in length.
- Wave C is often about equal to wave A.
- Alternation: if wave 2 is a sharp correction, wave 4 tends to be a sideways one, and vice versa.
Use Fibonacci ratios to mark zones where a wave could end, then let price confirm. Treat them as tendencies, not targets the market owes you.
Wave degrees
Waves are fractal. Every wave is made of smaller waves, and every pattern is part of a larger one. A wave 3 on an H4 chart can contain a complete five-wave impulse on an M15 chart.
Elliott named these levels degrees. From largest to smallest, the usual names are Grand Supercycle, Supercycle, Cycle, Primary, Intermediate, Minor, Minute, Minuette and Subminuette. You do not need to memorize them. What matters is that you know which degree you are trading and how it fits into the degree above.
Start your count on a higher timeframe, such as the daily or H4 chart, and then work down. A clean count on M15 that contradicts the H4 picture is usually the one to doubt.
Invalidation levels as stop locations
Every count has a price that proves it wrong. That invalidation level is a natural place for a stop loss, because if price reaches it, the reason for the trade is gone.
- If you think wave 2 is in progress, the count is invalid below the start of wave 1.
- If you think wave 4 is in progress, the count is invalid below the top of wave 1.
On a gold chart, wave 1 rises from 2,300.00 to 2,360.00, a move of 60.00. Wave 2 pulls back 50%, to 2,330.00. If wave 3 reaches 1.618 × wave 1, it would add 1.618 × 60.00 = 97.08, projecting to about 2,427.08. The invalidation level is 2,300.00. You buy at 2,332.00 with a stop at 2,298.00, a risk of 34.00, and a target at 2,420.00, a potential gain of 88.00. Reward-to-risk is 88 ÷ 34 ≈ 2.6. If price breaks below 2,300.00, the count was wrong and you lose the 34.00 between entry and stop, multiplied by your position size, plus any slippage. Even if the count is right, wave 3 may stop well short of the target.
The dollar value of each point depends on the contract size, which differs by broker, so check the contract specification and size the position from your stop distance.
Why alternate counts matter
Elliott Wave analysis is subjective. Two experienced analysts can count the same chart differently, and both counts can obey all three rules. That is why traders keep a primary count, the one they think most likely, and at least one alternate count.
In the gold example, the rise from 2,300.00 to 2,360.00 might be wave 1 of a new uptrend, or it might be only a bounce, wave B, inside a larger A-B-C decline. If price breaks below 2,300.00, the alternate takes over, and the decline may continue as wave C.
Before each trade, write down three things: the primary count, its invalidation level and the alternate count. If the alternate would hurt you badly, reduce your size or wait.
The automatic count in SPM Trader
As one of its premium tools, SPM Trader can draw an automatic Elliott Wave count on your chart. It shows the primary count, alternative counts, subwaves, the target zone for the next wave and the invalidation level. The Wave Scanner lists instruments in your Market Watch where it finds a count, with the target zone, invalidation level and reward-to-risk.
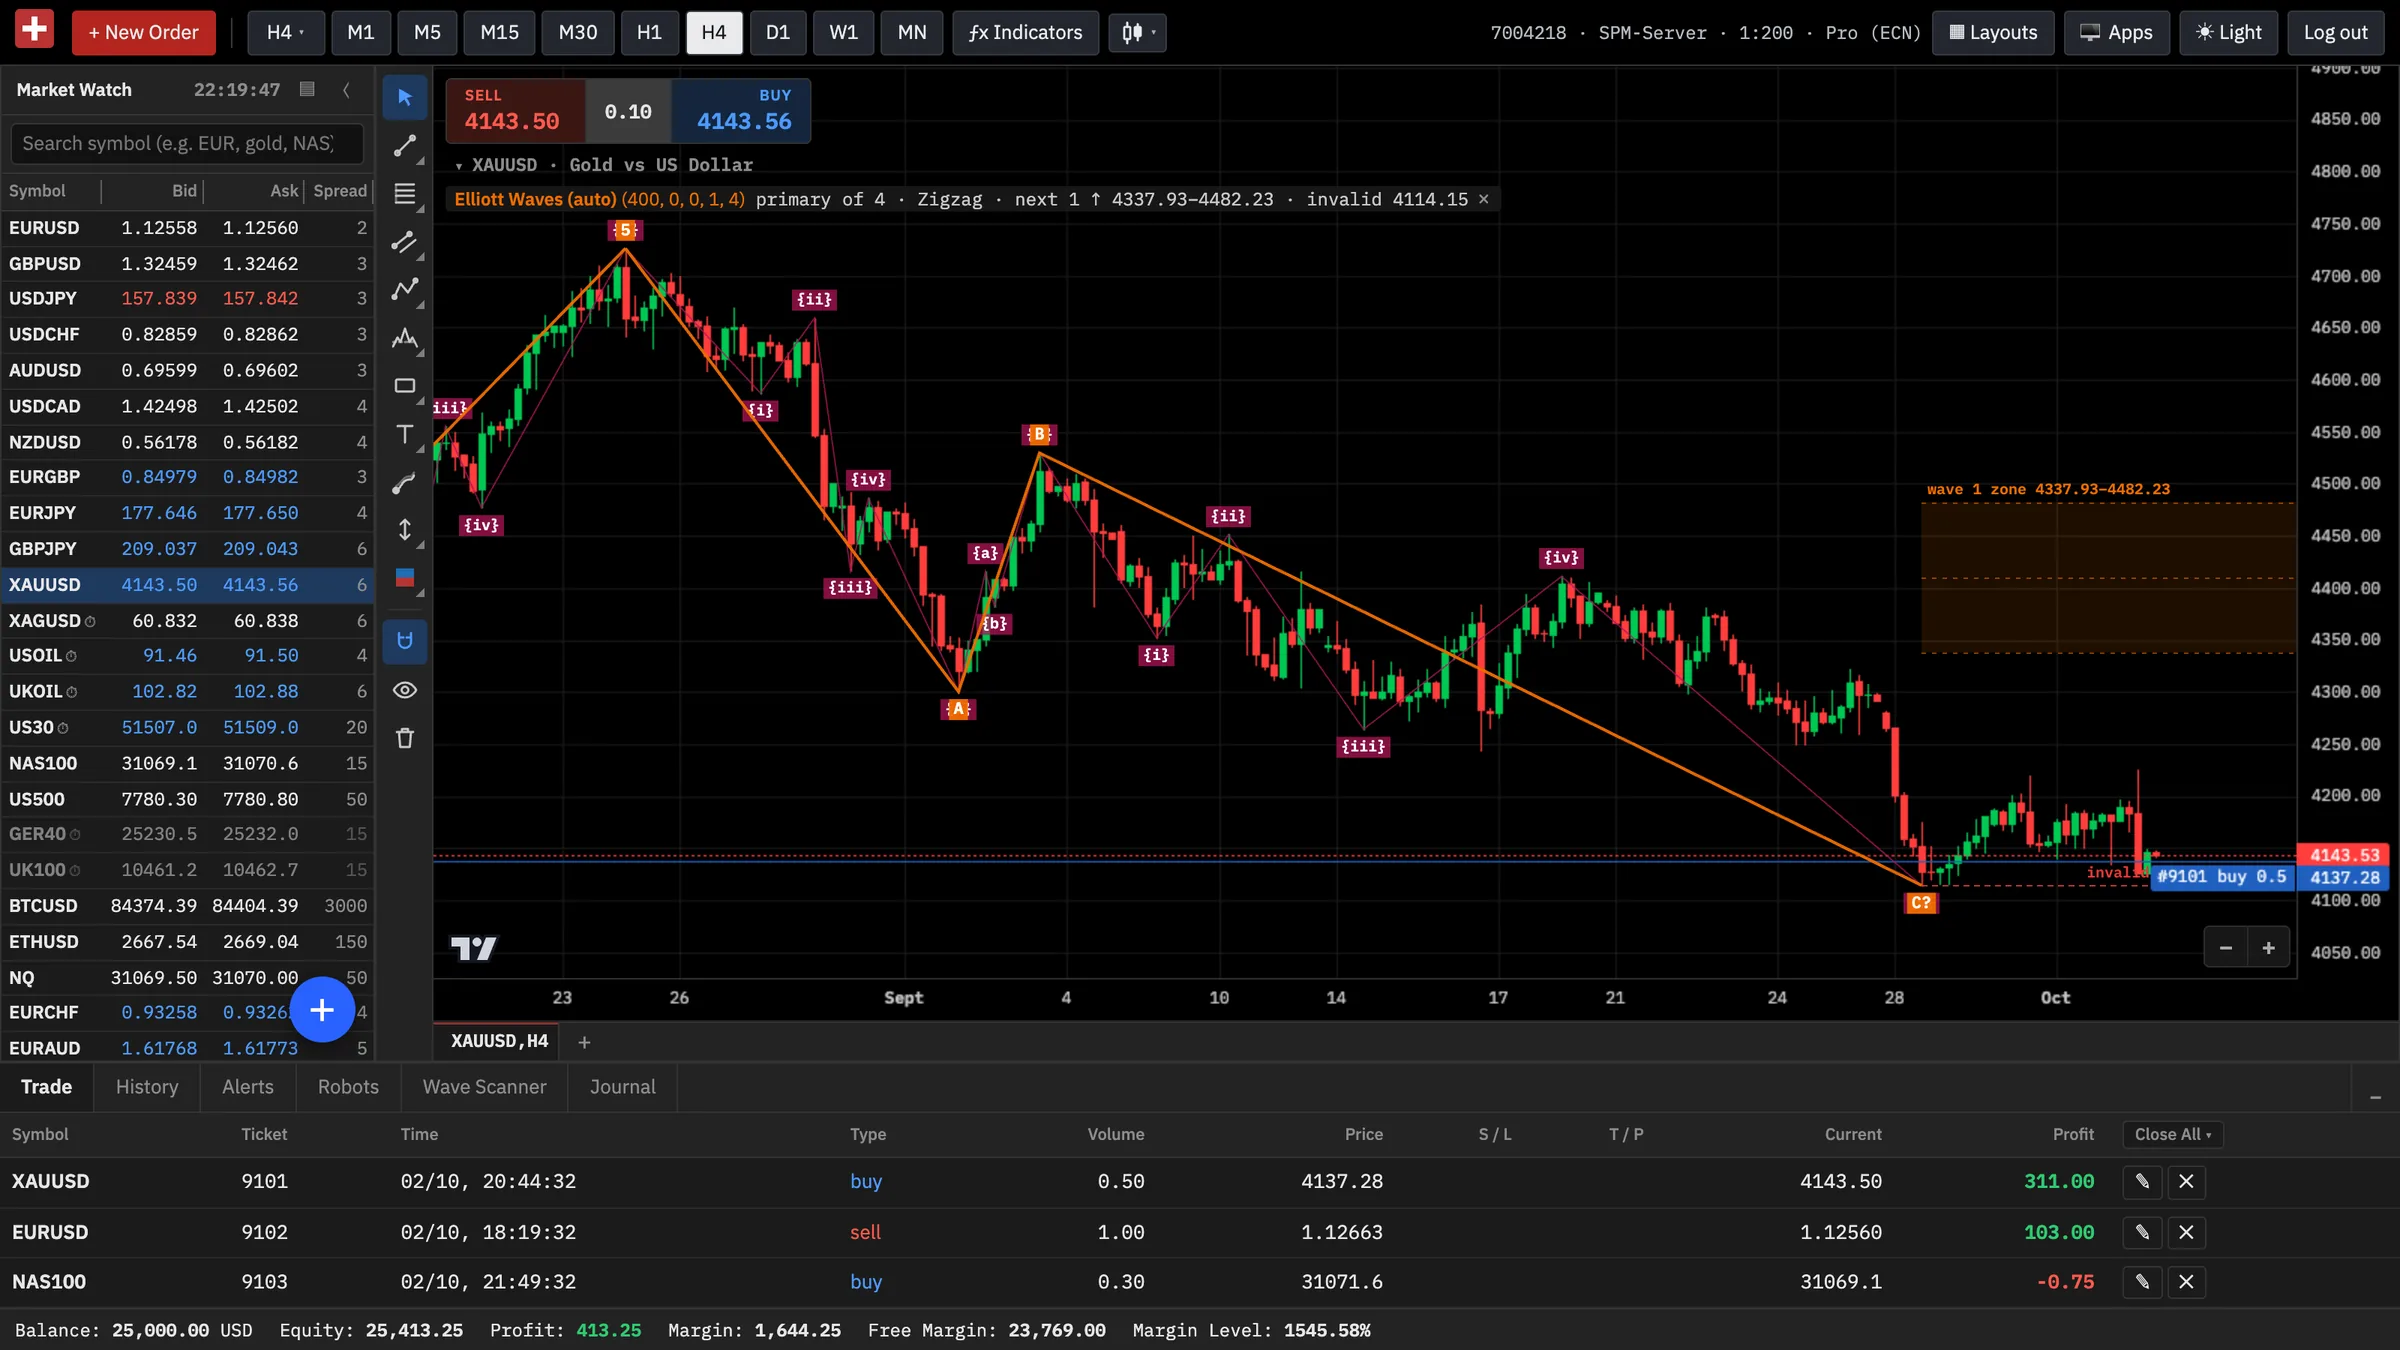
Treat the automatic count as an analysis tool, not a trading signal. It is one reading of the chart, produced by software, and like any count it can be wrong. Check that it fits the structure you see, decide your own entry, stop and size, and respect the invalidation level. You can practice reading counts without risking money if you open a free demo account.
Key takeaways
- An impulse has five waves with the trend; a correction usually has three, A-B-C.
- Three rules: wave 2 never retraces all of wave 1, wave 3 is never the shortest and wave 4 does not overlap wave 1.
- Fibonacci ratios and alternation are tendencies, not rules.
- The invalidation level is where the count is wrong, which makes it a natural stop location.
- Always keep an alternate count. Automatic counts are analysis tools, not signals.
This lesson is general education, not investment advice. Examples use illustrative numbers. CFDs are complex instruments and come with a high risk of losing money rapidly due to leverage.