What a trading robot is and what it is not
A trading robot is a program that watches prices and opens, changes and closes orders according to rules written in code. You may also see it called an automated strategy or an algorithm. Every time a condition is met, it does the same thing, at any hour, without getting tired or distracted.
What a robot does not do is find an edge for you. An edge is a repeatable reason why a set of rules should make more than it loses over many trades, after costs. If the rules have no edge, the robot will lose money with perfect discipline. Automation multiplies whatever is in the rules, good or bad.
- A robot does well: following rules exactly, acting the moment a condition is met, trading hours when you are asleep, sizing every position with the same formula and recording every action.
- A robot does not: judge whether the rules make sense, adapt to new conditions it was not programmed for, notice a news event unless you filter for it, or protect you from its own coding errors.
- A robot cannot guarantee the prices you saw in testing. Live fills depend on spreads, liquidity and the speed of the connection.
Drop a few common beliefs early. A smooth past equity curve does not mean a robot will keep producing one. More complex code does not mean a better strategy. And no robot should run unattended, because markets, platforms and connections all change.
A robot also removes one human weakness and keeps another. It cannot hesitate or panic in the middle of a trade, but the person who switches it on and off still can. Much of this course is about making those decisions in advance, in writing.
Consider the rule: buy when the 20-period moving average crosses above the 50-period moving average. A person reading it would skip a cross at 3:00 a.m. on a holiday, when the market is thin and spreads are wide. A robot will take that trade unless a rule tells it not to. Everything you would decide by common sense has to be written down.
Before you think about code, write the strategy on paper in plain sentences. If you cannot explain each rule in one sentence, a program cannot follow it either.
Turning an idea into exact rules
Most trading ideas start vague: buy the breakout in the morning. A robot needs every word defined. A complete rule set answers five questions.
- Entry: the exact condition, price and order type.
- Exit: where you take profit, and any exit based on time or a condition.
- Stop: where the stop loss goes, attached when the trade opens.
- Sizing: how much you risk per trade and how the lot size is calculated.
- Time filters: when the robot may trade and when it must stand aside.
Here is a generic opening-range breakout on a US stock index, written so a program could follow it. It illustrates precise wording. It is not a strategy known to be profitable.
- Market: a Nasdaq 100 index CFD on 5-minute bars. All times are New York time.
- Opening range: the highest high and lowest low from 9:30 to 10:00 a.m.
- Filter: skip the day if the range is under 20 or over 120 points, if a high-impact US release is due between 10:00 a.m. and noon, or on a Federal Reserve rate decision day.
- Entry: at 10:00 a.m., place a buy stop 2 points above the range high and a sell stop 2 points below the low. When one fills, cancel the other. One trade per day.
- Stop loss: at the midpoint of the range, attached to the order.
- Take profit: 1.5 × the stop distance from entry.
- Time exits: cancel unfilled orders at noon and close any open trade at 3:55 p.m.
- Sizing: risk 0.5% of equity. Lots = money at risk ÷ (stop distance in points × value of one point per lot), rounded down.
The range runs from 18,260 to 18,320, or 60 points, so it passes the filter. The buy stop sits at 18,322 and the sell stop at 18,258. The midpoint is (18,320 + 18,260) ÷ 2 = 18,290. If the buy stop fills, the stop distance is 18,322 − 18,290 = 32 points and the take profit is 18,322 + (1.5 × 32) = 18,370. With $20,000 in equity, 0.5% is $100. Suppose, for this example only, that one lot is worth $1 per point (check the real value in your contract specification): 100 ÷ (32 × 1) = 3.125, rounded down to 3.12 lots. Before costs, a full loss is 32 × 3.12 = $99.84 and a full win is 48 × 3.12 = $149.76.
Even this list leaves questions. What if price gaps through the buy stop, both orders could trigger in the same bar, or the platform is offline at 10:00? Your rules should answer each one.
Write the rules so that two people reading them would place exactly the same trades. If they would disagree on even one trade, the rule is not precise yet.
Backtesting and its traps
A backtest runs your rules over historical data and reports what would have happened. It is the cheapest way to reject a bad idea. It is also easy to make it flatter you. These are the traps that catch most people.
- Overfitting: tuning settings until the past looks perfect. With enough settings, rules can fit random noise. A warning sign is a result that only works with one exact value, for example a 30-minute opening range that wins while 25 and 35 minutes both lose.
- Look-ahead bias: using information that was not available at the time, such as the day’s high in a decision made at 10:00 a.m., or a bar’s close in a decision made while the bar was still forming.
- Survivorship bias: testing only on markets or stocks that exist today. Those that were delisted or dropped from an index are missing, so the history looks better than it was.
- Ignoring costs: spreads, slippage, commissions and swaps (overnight financing). Strategies with many small trades are hit hardest.
- Too few trades: 20 or 30 trades prove very little. With 20 trades, two wins turning into losses moves the win rate from 60% to 50%.
- Intrabar ambiguity: when the stop and the target both sit inside one bar, the test cannot know which was hit first. Assume the stop.
Aim for a few hundred trades that cover different conditions: trending and ranging markets, quiet and volatile periods. If the rules trade rarely, test them on a longer history or on several related markets.
A backtest shows 250 trades with an average gain of 3 points per trade before costs: 250 × 3 = 750 points. If spread and slippage cost 2 points per trade, costs total 250 × 2 = 500 points and the net result is 250 points. If real costs are 3.5 points per trade, costs total 875 points and the same rules lose 125 points. A small change in costs turned a winner into a loser.
Check the data too. Missing bars, bad ticks and price feeds that differ from the one you will trade on can all change the result. Use data from the same type of instrument you plan to trade, and note the source.
Run the backtest again with costs doubled. If the result turns negative, the edge is too thin to survive normal changes in trading conditions.
Out-of-sample and forward testing on a demo account
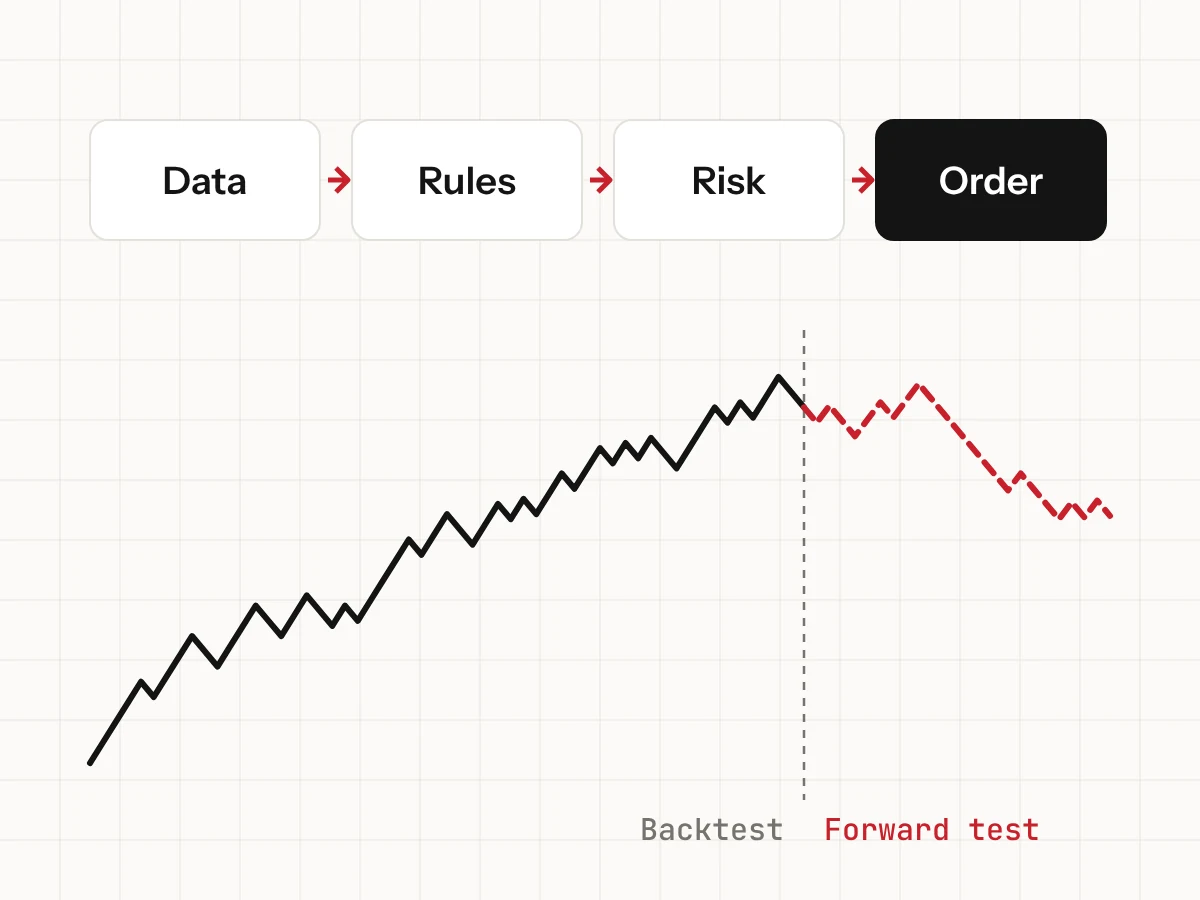
The data you use to build and tune your rules is called in-sample. Out-of-sample data is a period you set aside before you start and never look at while building. Testing on it is the first honest check of whether the rules found something real or just fit the past.
- Split your history before you start, for example build on 2017 to 2022 and hold back 2023 to 2025.
- Develop and tune the rules on the first part only.
- Write down pass and fail criteria.
- Run the finished rules once on the held-back period, with realistic costs.
- Compare the key numbers: win rate, average win and average loss, profit factor (gross profit ÷ gross loss), maximum drawdown and trades per month.
Run the held-back test once. If you change the rules after seeing the result and test again, that period has become in-sample and you need fresh data. A more thorough version, called walk-forward testing, repeats this on a rolling window: build on one period, test on the next, move forward and repeat.
In-sample, the rules made 300 trades with a profit factor of 1.45 and a maximum drawdown of 8%. Your pass criteria were a profit factor above 1.2 and a drawdown no larger than 1.5 × 8% = 12%. Out-of-sample, the rules made 120 trades with a profit factor of 1.05 and a drawdown of 12%. A profit factor of 1.05 means $1.05 won for every $1.00 lost. The drawdown is just inside the limit, but the profit factor fails, and a small rise in costs would turn it into a loss. The rules are not ready.
If the rules pass, the next step is a forward test: running them in real time, on live prices, on a demo account of the platform the robot was built for, for example for at least two to three months or 50 trades, whichever takes longer. It shows what a backtest cannot: real spreads at your trading hours, delayed or rejected orders, data gaps and bugs that only appear live.
You can also check the rules by hand. Open a free demo account, which comes with up to $100,000 in virtual funds, place each trade the rules call for and record the price you actually got. Base your position sizes on the amount you would really trade, not on the full virtual balance, so the results stay realistic.
Keep the backtest, out-of-sample and forward-test numbers side by side. If each stage is clearly worse than the one before, treat it as a warning, not bad luck.
Risk controls
Risk controls are rules that sit above the strategy. They do not make the robot more profitable. They limit the damage when the strategy, the market or the code behaves badly, and they should be in the code before the robot places its first trade.
- Fixed fractional sizing: risk the same percentage of equity on every trade, for example 0.5% or 1%. Position size shrinks after losses and grows after gains. The formula is in Managing risk and position size.
- Maximum daily loss: stop opening new trades for the day after losing, for example, 2% of equity or three trades in a row.
- Maximum drawdown kill switch: switch the robot off if equity falls a set amount from its peak, for example 10%, or 1.5 × the worst drawdown seen in testing, whichever comes first.
- One position at a time per robot and instrument, so a bug or a fast market cannot stack positions.
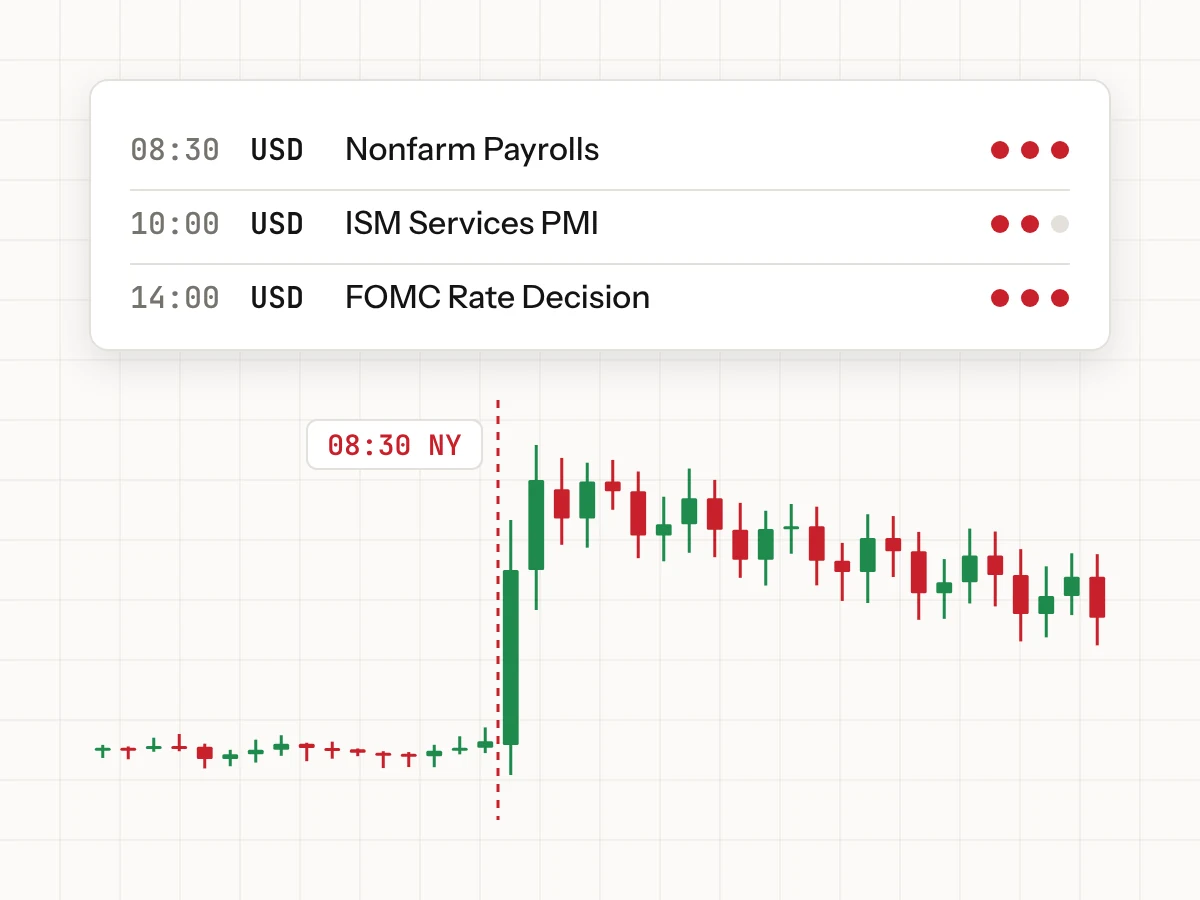
- News filter: no new entries from, for example, 15 minutes before to 15 minutes after high-impact releases. See Trading around economic releases.
- Hard caps: a maximum lot size per order, and a stop loss attached to every order when it is sent.
On a $10,000 account, 1% risk is $100 per trade. After a drawdown to $9,000, 1% is $90, so the robot automatically trades smaller. Ten losses in a row at 1% each, each taken from the shrinking balance, leave about $9,044, a drawdown of about 9.6%. At 5% per trade, the same streak leaves about $5,987, a drawdown of about 40%, and you would need a gain of about 67% to get back to $10,000.
That last number is why drawdown limits matter. Losses and the gains needed to recover them are not symmetrical:
- A 10% loss needs an 11.1% gain to recover.
- A 20% loss needs a 25% gain.
- A 50% loss needs a 100% gain.
Losing streaks are a normal part of any strategy, even one with an edge. Your limits should be wide enough to survive the streaks that testing showed, and tight enough to stop a broken robot before it does serious harm.
Put the risk limits in the code and in a written checklist next to your screen. If the code fails, the checklist is what tells you to switch the robot off.
Running and monitoring a robot
Once a robot is live, your job changes from building to supervising. A robot that runs without review can repeat the same mistake hundreds of times before anyone notices.
Start with logs. A good log lets you rebuild every decision the robot made. Record at least:
- Every signal, with the time and the values that triggered it.
- Every order sent, changed or canceled.
- The price you asked for and the price you got.
- The spread at entry and exit.
- Errors, disconnections and restarts.
- Equity at the end of each day.
Then compare live trading with the backtest. Run the backtest over the same live period after the fact. The trades should match. Missing trades point to filters, data or connection problems. Extra trades usually point to a bug. Different prices show you the real cost of slippage.
Over 40 live trades, average slippage is 1.2 points per trade, while the backtest assumed 0.5 points. The difference is 0.7 points per trade, or 0.7 × 40 = 28 points the backtest never counted. If the backtest showed a net edge of 1 point per trade after costs, the extra 0.7 points removes 70% of it.
Decide in advance when you will switch the robot off. Common reasons:
- A risk limit is hit: the daily loss limit or the drawdown kill switch.
- The robot does something the rules do not allow, which means a bug.
- Live costs stay above what testing assumed.
- A losing streak or drawdown goes beyond the worst seen in testing.
- Conditions change in a way the rules were never tested on, such as new trading hours, a new contract specification or volatility far outside the test period.
- You will not be able to watch it, for example while traveling.
Just as important: do not switch it off only because of a normal losing streak that falls within what testing showed. Turning a robot on and off based on feelings turns a rule-based system back into a discretionary one.
Set a fixed review time, for example every Friday after the close. Compare the week’s live trades with the rules one by one, and write down any difference you cannot explain.
Key takeaways
- A robot executes rules. If there is an edge, it has to come from the rules, not from the automation.
- Write rules so precise that two people would place exactly the same trades.
- Test with realistic costs, enough trades and an untouched out-of-sample period, then forward test on a demo account.
- Build risk limits into the code: fixed fractional sizing, a daily loss limit and a drawdown kill switch.
- Log everything, compare live fills with the backtest and decide in advance when to switch the robot off.
This lesson is general education, not investment advice. Examples use illustrative numbers. CFDs are complex instruments and come with a high risk of losing money rapidly due to leverage.